Cauchy Mean Value Theorem/Geometrical Interpretation
Geometrical Interpretation of Cauchy Mean Value Theorem
Consider two functions $\map f x$ and $\map g x$:
- continuous on the closed interval $\closedint a b$
- differentiable on $\openint a b$.
For every $x \in \closedint a b$, we consider the point $\tuple {\map f x, \map g x}$.
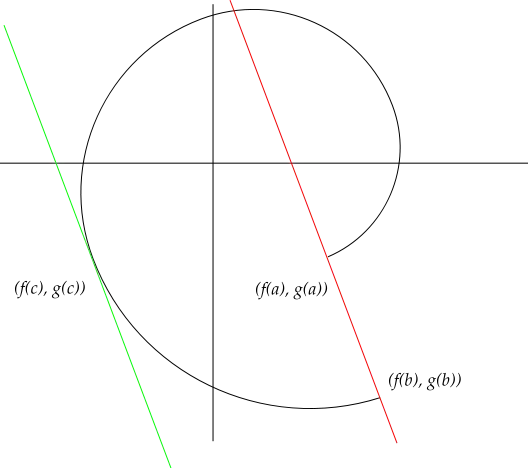
If we trace out the points $\tuple {\map f x, \map g x}$ over every $x \in \closedint a b$, we get a curve in two dimensions, as shown in the graph:
| This article, or a section of it, needs explaining. In particular: An explanation is needed as to the coordinate frame used to depict this. You can help $\mathsf{Pr} \infty \mathsf{fWiki}$ by explaining it. To discuss this page in more detail, feel free to use the talk page. When this work has been completed, you may remove this instance of {{Explain}} from the code. |
In the drawing, the slope of the red line is $\dfrac {\map g b - \map g a} {\map f b - \map f a}$.
This is because:
- $\dfrac {\Delta y} {\Delta x} = \dfrac {\map g b - \map g a} {\map f b - \map f a}$
assuming that the vertical axis, which contains the value of $\map f x$, is the $y$-axis.
The slope of the green line is $\dfrac {\map {g'} c} {\map {f'} c}$.
This is because:
- $\valueat {\dfrac {\d g} {\d f} } {x \mathop = c} = \valueat {\dfrac {\d g / \d x} {\d f / \d x} } {x \mathop = c} = \dfrac {\map {g'} c} {\map {f'} c}$
The graph illustrates that for the value of $c$ chosen in the graph, the slopes of the red line and green line are the same.
That is:
- $\dfrac {\map g b - \map g a} {\map f b - \map f a} = \dfrac {\map {g'} c} {\map {f'} c}$
Sources
- sid-kap (https://math.stackexchange.com/users/120716/sid-kap), Geometrical Interpertation of Cauchy's Mean Value Theorem, URL (version: 2015-05-19): https://math.stackexchange.com/q/1290321